Surface runoff
Problems arisen from runoff
The quantity of rainfall can be said as a sum of evaporation, infiltration, depression storage and surface runoff. Surface runoff is a surplus over the other losses. By gravitation laws, liquids on the surface will flow to the nearest stream channel. If the rain is particularly intense or prolonged, the excess runoff would become large that the stream channels cannot accept those quantity of water. And hence the channels become overflow and cause flooding which may damage nearby properties and life. In order to deal with runoff, the hydraulic engineers have arisen many questions concerned with magnitude and dimension of runoff for a particular catchment with respect to time. In addition, frequency and duration of discharge with time are also considered by hydraulic engineers.
Catchment characteristics
Catchment area
Catchment area means the whole of the land and water surface area contributing to the discharge at a particular stream, which every point on a stream channel has a unique catchment of its own. This area is usually bounded by the topographic water-divide. As runoff is expressed as a quantity of catchment per unit area, when there is a large catchment area, the decrease would be the peak runoff. Due to greater areal extent of the groundwater aquifers and minor local rainfall, the minimum runoff per area also increased in a large catchment area.
Main stream length
This is measured from the gauging station or catchment outfall in km.
Slope of catchment
For steeper slopes, the peak runoff would be greater as the concentration time is shorter.
Catchment orientation
The pattern in runoff hydrograph will have some degree on the catchment's orientation if there is a seasonal pattern of wind and storm direction.
Shape of catchment
The shape of a catchment affects the runoff when a rainstorm doesn't cover the whole catchment anytime, but moves over it.
Annual average rainfall
This is a record of the rainfall in graphical form.
Stream frequency
The stream frequency affect the runoff rate and hence shorten the time of concentration if frequency is high.
Baseflow index
This is an index obtained from the ratio of the flow under separated hydrograph and that under total hydrograph. It indicates the catchment's underground storage.
Lake & reservoir area
They stores surface and smooth out hydrograph.
Soil-moisture deficit
As discussed in the soil-moisture section of Infiltration & Percolation.
Climatic factors
Storm movement is one of the factor affects the surface runoff. If the areal extent of storm is not covering the whole catchment, the runoff would be lesser. The main effect of climate is the rainfall intensity and hence the rainfall duration (intensity = depth/time). Rainfall intensity has a direct bearing on runoff since the excess rain flows to the surface water-courses.
Influence of duration on runoff hydrograph
When uniform intensity rain with constant depth is found, it can be defined as covering the whole catchment area. After the period of concentration, the runoff rate becomes constant. The effect of short periods of rain can be found by the subtraction of two hydrographs of long periods. , exceeding time of concentration and separated by short period.
Rainfall/Runoff correlation

There is a general cause-and-effect relationship (but not direct) between rainfall and the resulting runoff. It's possible to establish an empirical relationship for particular catchment based on annual precipitation and annual runoff. In order to do this establishment, it's better to use a water-year rather than a calendar year. This is a 12 month period starting and finishing at time of seasonal minimum flow. Rainfall and runoff correlation can be expressed as:

where P is annual precipitation
R is annual runoff
Variations from the straight line may due to markedly higher/lower groundwater levels in preceding year and the variation in seasonal distribution of rainfall.
Flow rating curves
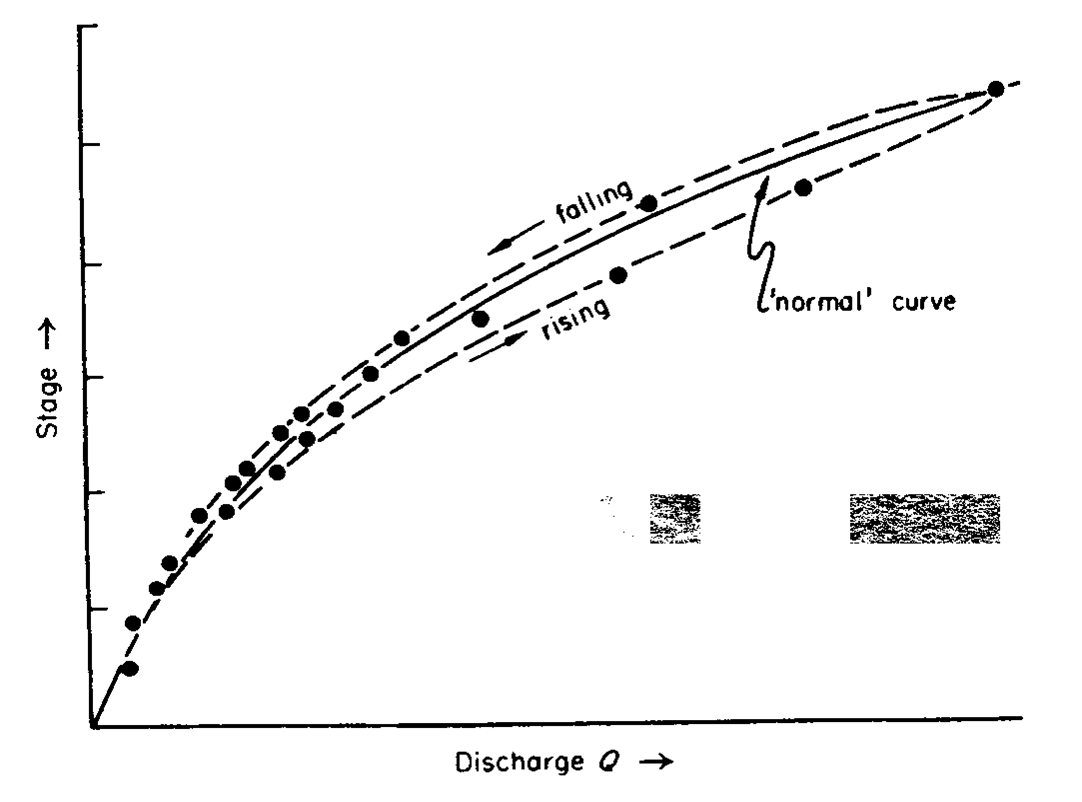
A rating curve is a graph that shows the relation between water level elevation (stage) and discharge at certain cross-section. If each discharge point is being measured on falling or rising stage, the curve would become a loop. This looping effect is due to channel storage, ,and the variations in surface slope as flood wave moves along channel. ,and the variations in surface slope as flood wave moves along channel.
Rating curve adjustment

From Manning formula

Where A is the Area
Q is the Flow rate
m is the hydraulic radius
s is the slope of water surface
n is the manning coefficient
A, m, n are constants and s changes with Q.
The raising stage will give a greater slope discharge, so measurements taken on it will plot to the right on the rating curve. Alternatively, for falling stage, it will plot to the left on the rating curve. What we need to do, is to correct discharge measurement to steady state condition. The steady-state discharge Q is given as:

Introducing
dh/dt
(which is positive for rising stages and negative for falling stages),


Flood wave celerity, U is approximately equal to 1.3 times the mean water velocity:
 

Extension of rating curves
Due to rare occurrence of high flood conditions, it is needed to determine probable discharge occur at long return period. There are three ways to attempting rating curve extension.
1. Fitting an equation to curve

where h = stage
k & x = constant
2. Steven's method
By Chezy formula:

where A = cross-sectional area
C = Chezy roughness coefficient
m = hydraulic radius
s = slope of the energy line

So the formula becomes

3. Slope-area method
From Manning's equation,

Water slope and area is measured in this method. This method is sometimes criticised because of its dependence on n.
Hydrographs
A hydrograph is normally plotted as discharges vs. time. As there is baseflow only (the groundwater contribution from aquifers), it discharges more and more slowly with time. The hydrograph of baseflow is represented as:

where Qo = discharge at start of period
Qt = discharge at end of time t
α = coefficient of aquifer
e = base of natural logarithms
Components in hydrographs
- Net/effective rain
gross rain (infiltration, evaporation, interception losses)
- rising limb
- recession limb
- groundwater depletion curve
infiltration and percolation continuing during gross rain period
Contribution of baseflow
- influent stream
negative base flow, stream feeds groundwater
- effluent stream
positive base flow, groundwater feeds stream
act as drain for bordering aquifer
- perennial stream
low dry-season flow fed by base flow
mainly effluent streams
Unit hydrograph
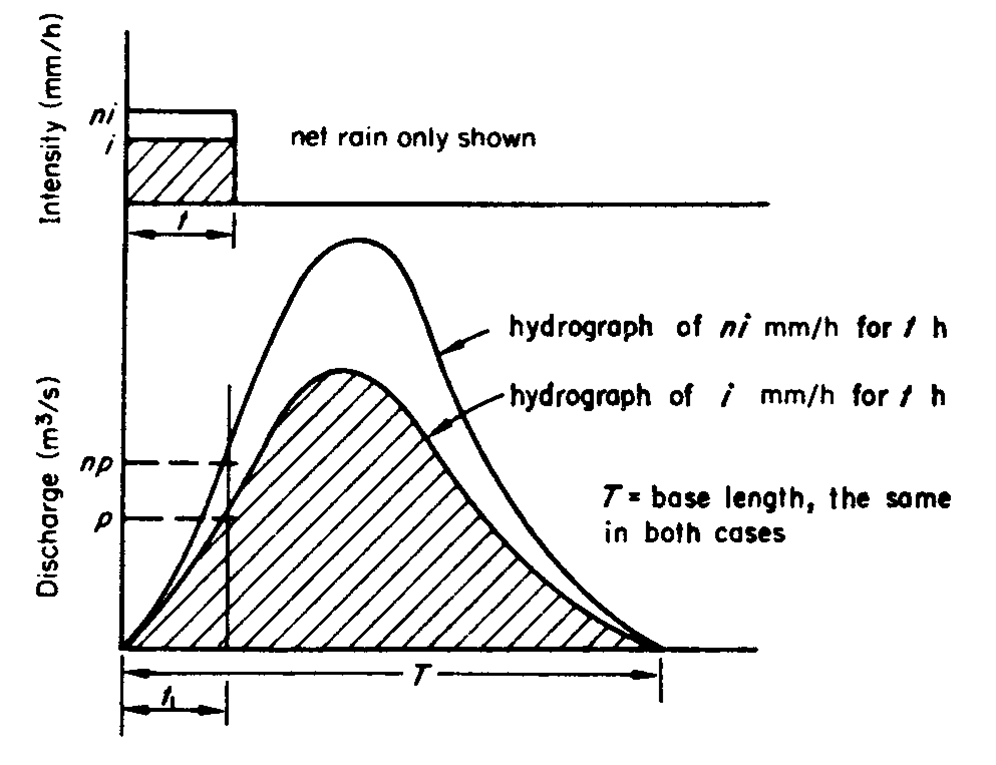
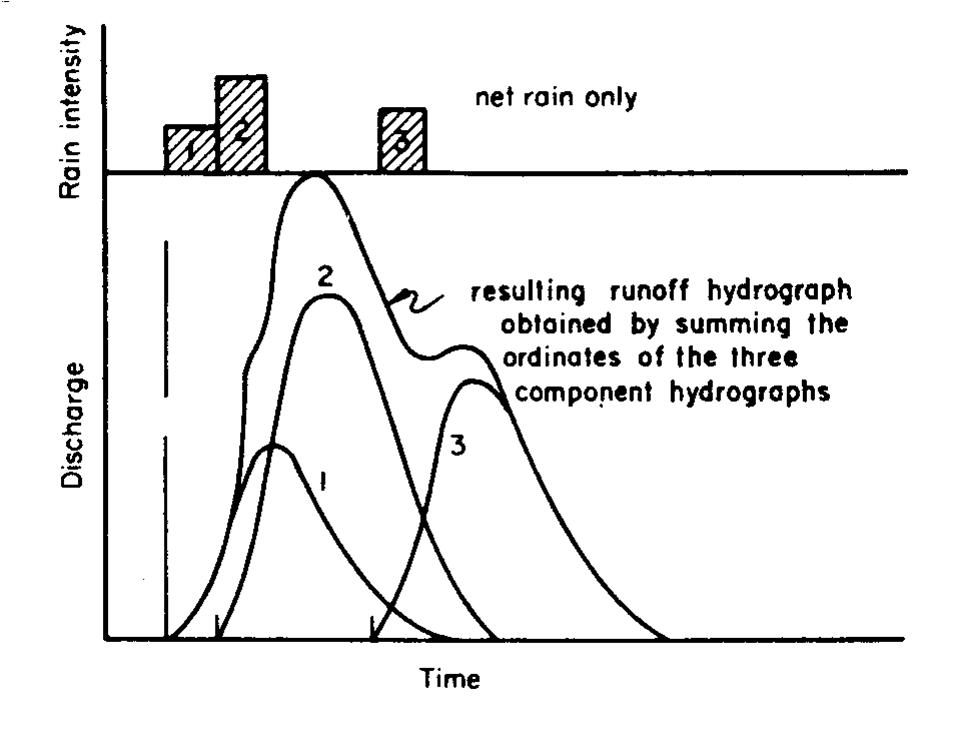
It should be emphasised that the correlation is between net/effective rain and surface runoff. The method involves three principles:
1. Different intensities of rain of same duration produce runoff of same period of time.
2. Principle of proportion - different rain intensities of same duration produce runoff hydrograph in same proportion as intensities
3. Principle of superposition
Unit rain concept:
Unit depth (L) is usually 1cm over the catchment area (L2). And the volume of rainfall would be L3. From area under hydrograph curve,

Therefore, the quantities involved are identical. If the unit graph of duration t1 for a catchment is known, then the runoff from any other rain of the same duration can be predicted. And so, we can transform unit graph to other duration t2.
Method of superposition
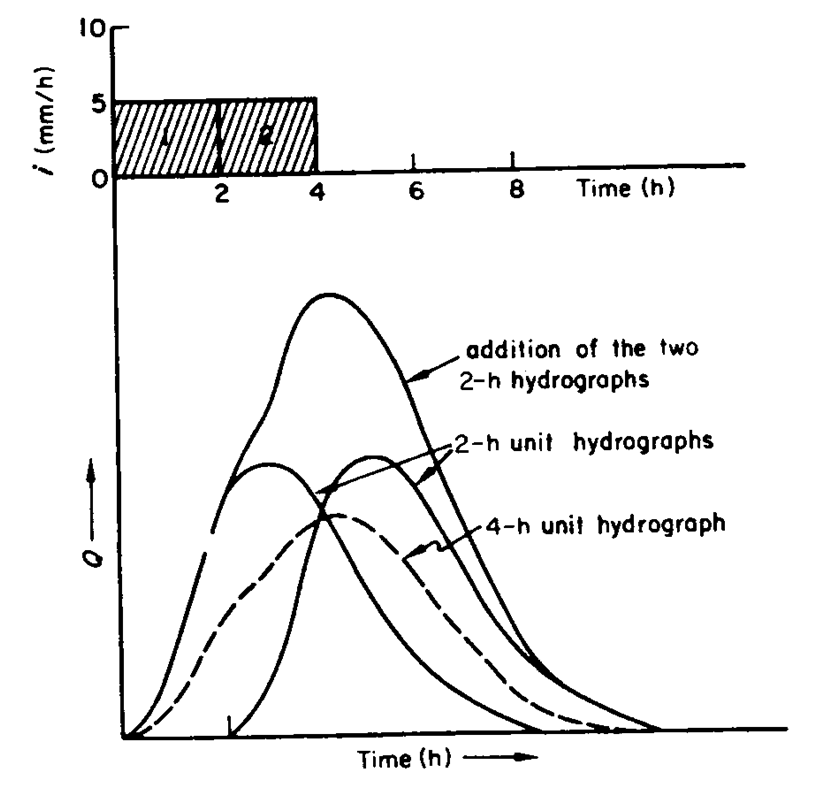
If a discharge-time unit hydrograph is available, and it is desired to develop a unit hydrograph of discharge-n*time, where n is an integer. This method is proposed to change a unit graph of short duration t1 to a unit graph of longer duration t2. That is,  . 'N' unit and 'Nt1' duration hydrograph is the sum of unit graph of duration t1 with time lag t1. The above hydrograph over N would be the unitgraph of duration t2. . 'N' unit and 'Nt1' duration hydrograph is the sum of unit graph of duration t1 with time lag t1. The above hydrograph over N would be the unitgraph of duration t2.
S-curve method
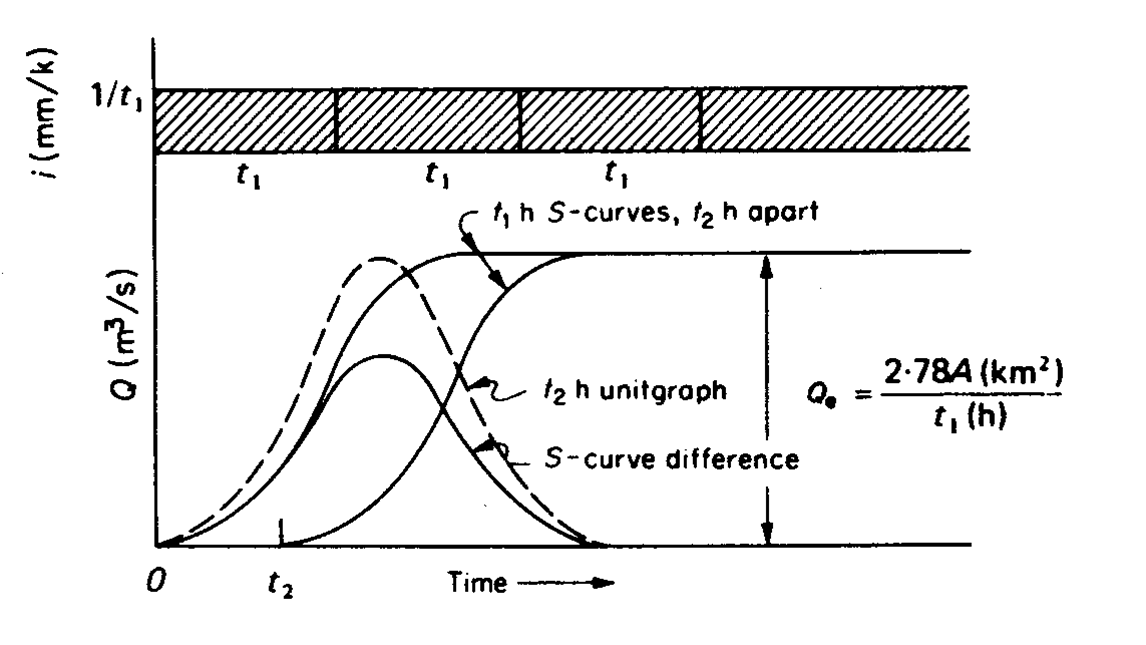
In this method, there is no limitation on t, therefore, t2 can be greater or lesser than t1. S-curve is the hydrograph of runoff of continuous rainfall at an intensity of 1/t1 , the discharge of the catchment become constant after time of concentration, tc.
To execute S-curve method, the first step is to shift the unit graph by t2. Then,

The above hydrograph times (t1/t2) would be the t2 hr unit hydrograph.
In order to check the validity of unit graph, equilibrium flow, Qe in m3/s is introduced:
Since 1 cm of rain on the catchment is being supplied and removed every t1 hr,

where A is catchment area (km2)
t1 is duration (hr)
And Qe is the tabulated S-curve terminated value.
Flood Routing
Flood routing is a procedure to obtain hydrograph at downstream point D(t) from hydrograph for point upstream I(t). It is a process that shows how a flood wave be reduced in magnitude and lengthened in time by storage in reach between two points.
The storage equation
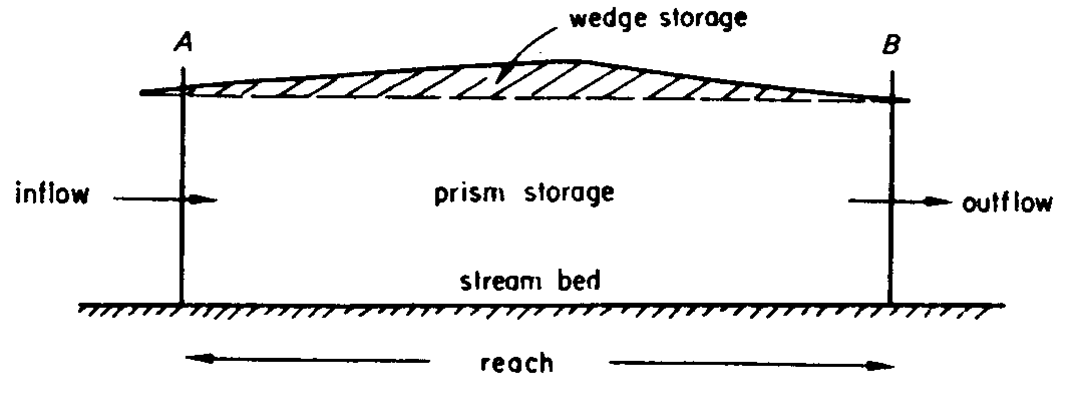
It is assumed that storage capacity will no change substantially in time so can be used to route predicted longer flood. Storage in the reach of a river is divided into two parts, prism storage and wedge storage. This is simply as the slope has a non-uniform surface during flood.
Continuity of flow through reach:

where t = inflow to reach
D = discharge to reach
dS/dt = rate of change in reach storage
For time interval t, the equation can be approximated as

1 and 2 represents the start and end of time t respectively.
Reservoir routing
In a reservoir, it is assumed that there is no wedge storage. Therefore, discharge is a function of surface elevation. As reservoir receiving inflow at one end and discharge through spillway at the other end, storage (S) is a function of discharge (D) only. The required information are:
1. elevation - discharge curve
2. elevation - storage curve
3. inflow hydrograph
Calculation procedure:
1. Choose a storage unit so that routing period t = 1 unit.
2. Construct D vs S ± Dt/2 and S relationships
3. Assume initial discharge D1
4. Find (S1 - D1t/2) from D vs S ± Dt/2 curve
5. Average successive pairs of inflow value (I1+I2)/2
6. Arrange all known terms on LHS:

7. Insert known values to obtain 
8. Deduce corresponding D2 from D vs S ± Dt/2 relationship
9. D2 becomes D1 in next routing period
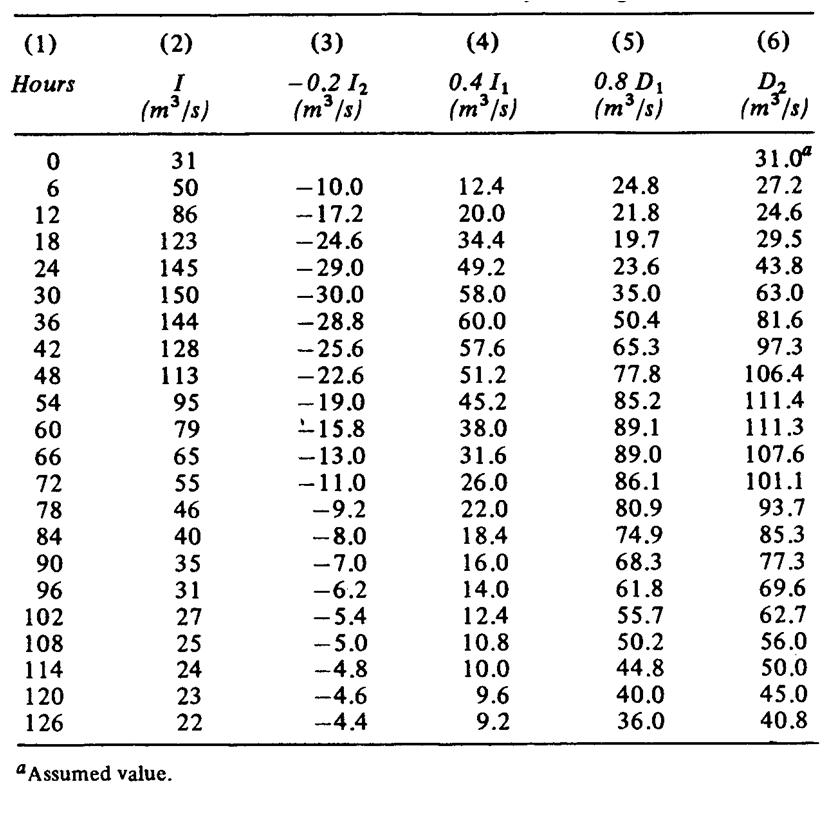
Routing in a river channel
This is more complicated than reservoir as it involves wedge storage. As storage is no longer a function of discharge only, we introduce the Muskingum method, which storage is function of both inflow and outflow:

where x = dimensionless constant for that river reach
K = storage constant (dimension[T])
Calculation procedure:
1. try different values of x and plot S vs [xI+(1-x)D] until linear relationship is established.
2. Obtain K by measuring slope of line.
3. Apply storage equation

and sub in Muskingum equation


Where   
Graphical routing methods
1. If x = 0, S = KD
then 
Appling storage equation:


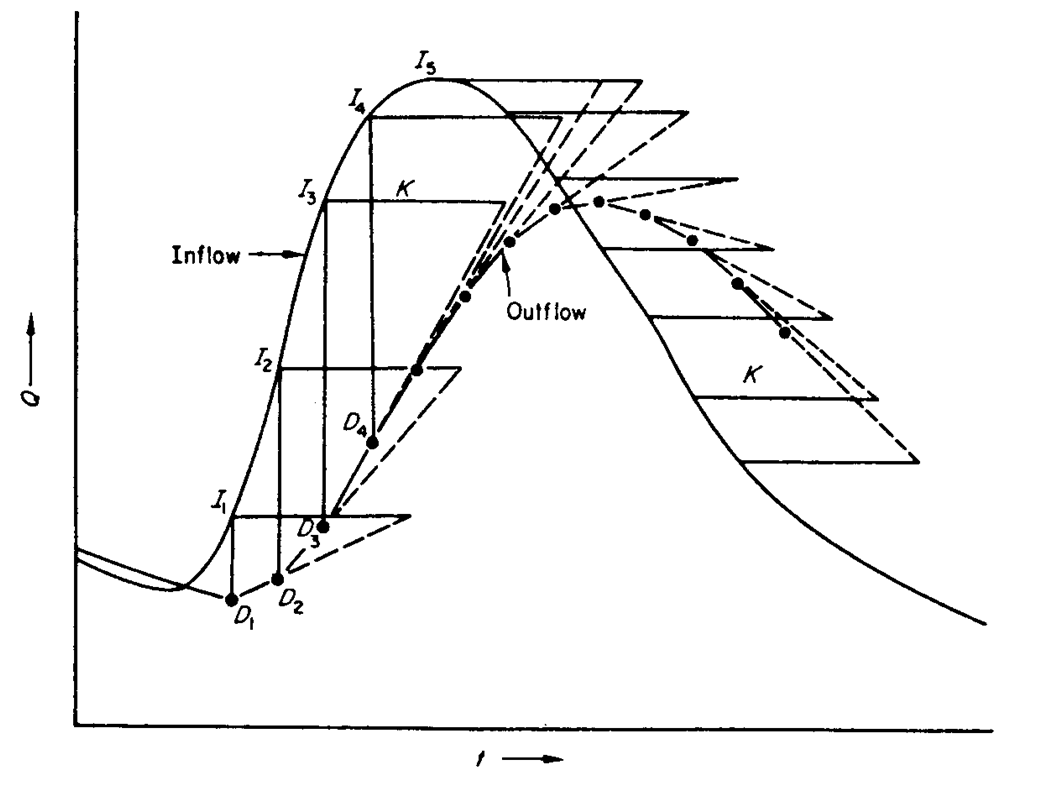
dD/dt represents the slope of outflow hydrograph and K is then plotted horizontally from each I value.
2. Draw line from the end of K line to previous D value
3. Construct outflow hydrograph (provide small time interval to make better accuracy, no equal time interval is needed)
Remarks: 1. K can be varied if its variation if known.
2. For Reservoir routing, apply x = 0
Examples:
Click here to see the examples
|